
CMS Data Study
Do CMS star ratings affect nursing home occupancy?
We analyzed all 14,695 Medicare and Medicaid certified skilled nursing facilities in the United States using the June 2026 CMS Provider Information release. Overall star rating explains roughly 1% of the variation in occupancy. Nursing staff turnover correlates nearly twice as strongly.
By Robert Tanner
Published August 1, 2026
Data CMS, JUNE 2026
Sample n = 14,695
Key Findings
01
Across 14,396 rated US skilled nursing facilities, the correlation between CMS overall star rating and occupancy is r = 0.109, meaning star rating accounts for roughly 1% of the variation in how full a facility is.
02
Occupancy averages 77.0% at one star and 81.8% at five stars. Fewer than five percentage points separate the bottom of the rating scale from the top.
03
The relationship is not an artifact of state-level differences. Measured within individual states, the average correlation is 0.085, slightly weaker than the national figure.
04
Nursing staff turnover correlates nearly twice as strongly with occupancy at r = −0.188. US facilities under 30% annual nursing turnover average 83.3% occupancy, against 75.6% for those above 60%.
05
762 five-star skilled nursing facilities in the United States are operating below 75% occupancy.
Contents
- How much does occupancy change across the star scale?
- Is the weak correlation just a state-level effect?
- What correlates with occupancy more strongly than star ratings?
- Why are 762 five-star facilities under 75% full?
- What this means for a skilled nursing operator
- Frequently asked questions
- Methodology
How much does occupancy change across the star scale?
Across the June 2026 CMS data, average occupancy at one-star US skilled nursing facilities is 77.0%, and at five-star facilities it is 81.8%.
If the CMS Five-Star Quality Rating System were the primary driver of where post-acute patients go, occupancy would climb steadily as you move up the scale. It does not. Fewer than five percentage points separate the bottom of the scale from the top, and the correlation across all 14,396 rated facilities is r = 0.109, which squares to roughly 1% of explained variance.
For a 100-bed skilled nursing facility, moving from one star to five stars is associated with about five additional residents on an average day, and that association assumes the rating caused the difference rather than simply traveling alongside it.
Figure 1
Mean occupancy by CMS overall star rating, US skilled nursing facilities, June 2026
Occupancy — scale 60% to 90%
Occupancy calculated as average number of residents per day divided by number of certified beds. Facilities without a rating or reported census excluded. n = 14,396.
Table 1 — Mean occupancy by CMS overall star rating, June 2026
CMS overall star rating
Mean occupancy
1 star
77.0%
2 stars
79.4%
3 stars
81.0%
4 stars
81.5%
5 stars
81.8%
Pearson r = 0.109 across 14,396 rated facilities. Source: CMS Provider Data Catalog, June 2026.
Is the weak correlation just a state-level effect?
The first reasonable objection to a national correlation this weak is that it might be an artifact of geography. States differ enormously in bed supply, payer mix and rating distribution, so a national figure could be washing out a relationship that shows up clearly inside any single market.
Measured within individual states, the average correlation between star rating and occupancy is 0.085, slightly weaker than the national figure of 0.109.
We re-ran the analysis state by state, limited to states with more than thirty rated facilities. The relationship did not strengthen. Whatever is filling skilled nursing beds is not showing up in the star rating at the market level either.
A note on the size of the claim. This is not zero. The correlation is real, it is positive, and a higher CMS rating is better than a lower one for reasons that extend well beyond census. The finding is that star rating is a very small part of the occupancy picture, not that it is irrelevant.
Figure 2
Mean occupancy by CMS overall star rating, US skilled nursing facilities, June 2026
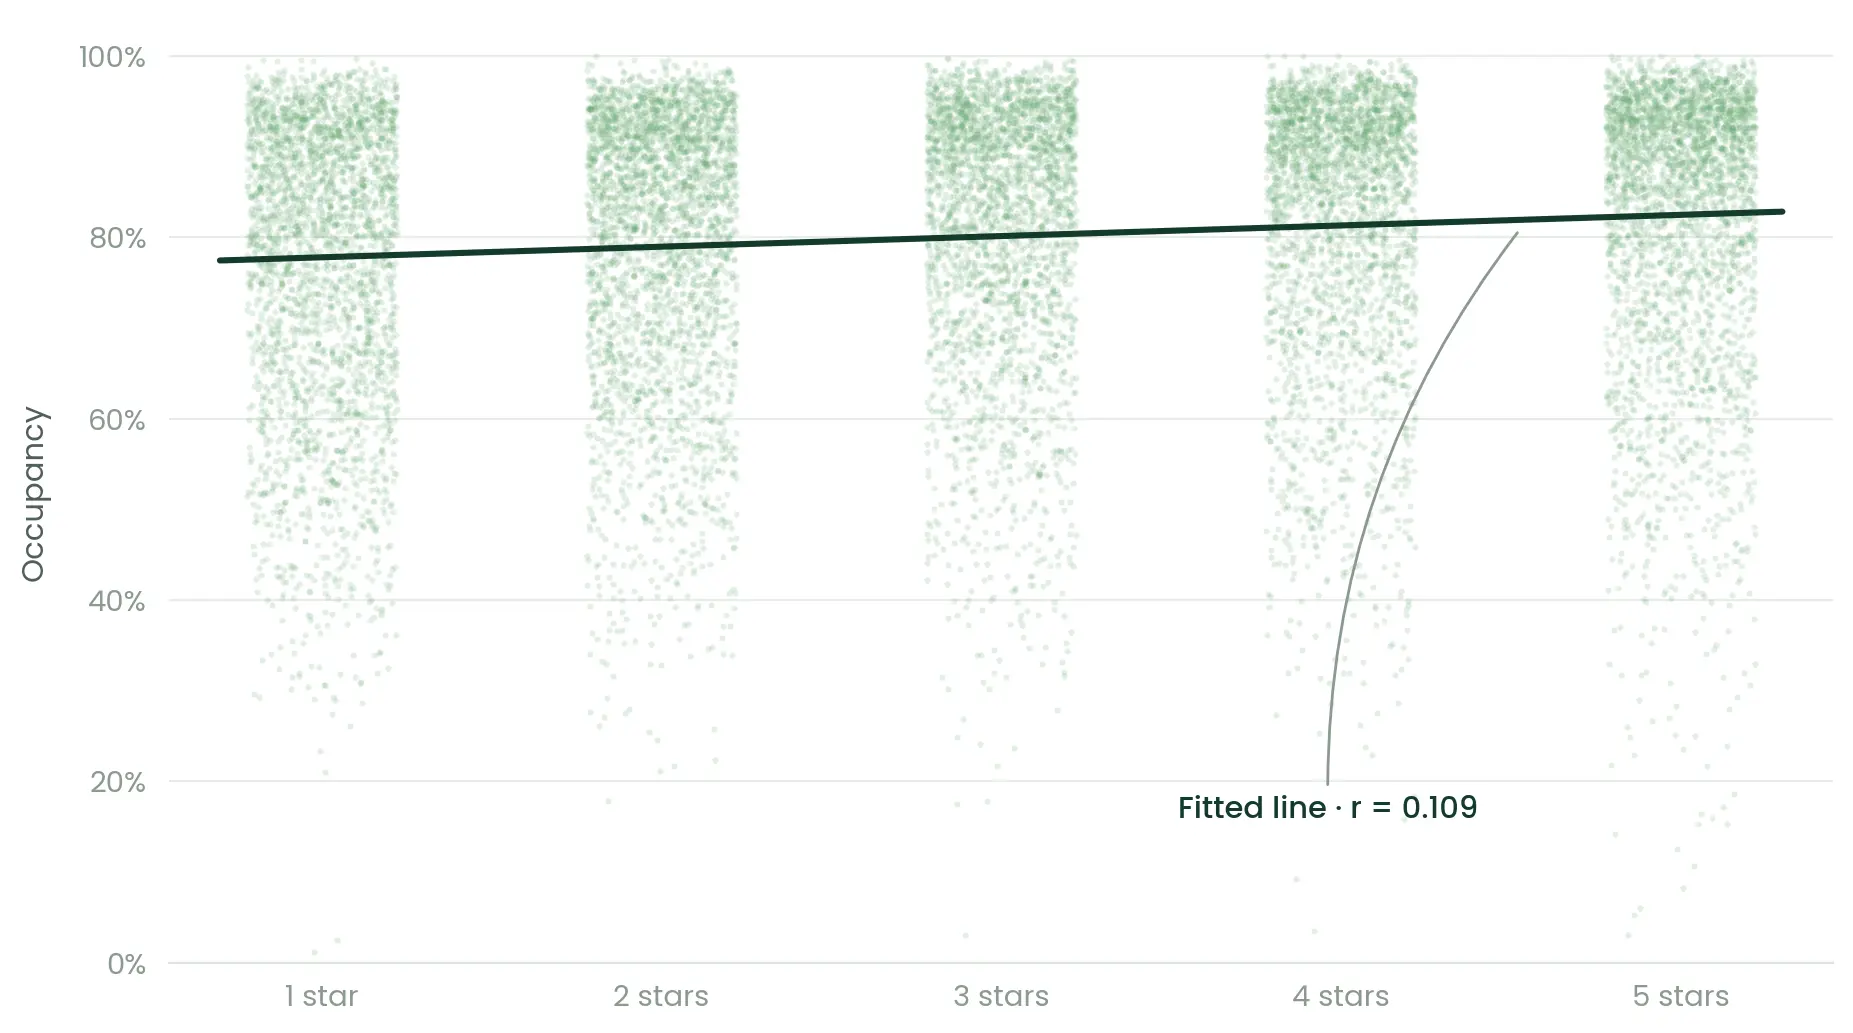
Each point is one skilled nursing facility, with horizontal jitter added within each rating for legibility. n = 14,396. The fitted line is nearly flat, and facilities at every rating operate at nearly every level of occupancy.
What correlates with occupancy more strongly than star ratings?
A study that only reports what does not matter is of limited use to anyone running a building, so we tested the other variables available in the CMS files. The strongest single relationship we found does not appear on the report card at all.
Nursing staff turnover correlates with occupancy at r = −0.188, nearly twice the strength of the star rating relationship.
US skilled nursing facilities keeping annual nursing turnover under 30% average 83.3% occupancy. Facilities above 60% turnover average 75.6%. That is a spread of nearly eight percentage points, against fewer than five across the entire five-star scale.
Figure 3
Mean occupancy by nursing staff turnover, US skilled nursing facilities, June 2026
Occupancy — scale 60% to 90%
Turnover as reported in CMS payroll-based journal staffing data. n = 13,249. The gap between the highest and lowest turnover bands exceeds the gap across the entire star rating scale.
Table 2 — Mean occupancy by nursing staff turnover band, June 2026
Annual nursing staff turnover
Mean occupancy
Under 30%
83.3%
30–45%
82.8%
45–60%
80.4%
60% or more
75.6%
Pearson r = −0.188 across 13,249 facilities reporting both turnover and census. Source: CMS payroll-based journal staffing data, June 2026.
It is worth being careful about what this establishes. Turnover and occupancy plainly move together, but this analysis cannot say which direction the causation runs, and it is entirely plausible that it runs both ways at once. A building that stays full is a steadier place to work, and a building where the same aide shows up every Tuesday is an easier building to refer into. What the number does say is that the staffing situation sits closer to the center of the census question than the rating on the door.
Why are 762 five-star facilities under 75% full?
762
US skilled nursing facilities holding the highest possible CMS overall star rating while operating below 75% occupancy, as of the June 2026 CMS release.
The inverse is just as telling. In the same release, 739 one-star facilities are operating at 90% occupancy or better, which is difficult to reconcile with the idea that referral sources screen strictly by rating.
This is the finding that tends to land hardest with operators, because most people in this industry can name one of these buildings without looking anything up. They are well run, they are clinically strong, they have the survey history to prove it, and they still have empty beds. Whatever is keeping those beds empty is not a quality problem, and no amount of further clinical improvement is going to solve it.
What this means for a skilled nursing operator
The CMS rating matters. It matters to families comparing options, it matters to the hospital case manager scanning a discharge list, and it matters for reasons that have nothing to do with census. But it is a small input into a decision made using a great deal of other information, most of it gathered before anyone visits the building.
For an administrator sitting at two or three stars and working hard to move up, that should come as some relief, because it means the census problem is not gated behind a number that takes years to change. And for the 762 facilities sitting at five stars with empty beds, it means the answer is somewhere else entirely, which is worth knowing before another quarter goes by.
Our own view, formed over a decade of doing this work inside a skilled nursing operating company, is that most of the gap sits in the space between the referral and the bed. How quickly the phone gets answered. What a family finds when they search the facility at eleven at night. Whether anyone is walking into the referring hospital often enough to be remembered. None of that appears on Care Compare, and all of it is fixable in months rather than years.
Frequently asked questions
Do CMS star ratings affect nursing home occupancy?
Only slightly. Across 14,396 rated US skilled nursing facilities in the June 2026 CMS data, star rating correlates with occupancy at r = 0.109, accounting for roughly 1% of the variation in how full a facility is. One-star facilities average 77.0% occupancy and five-star facilities average 81.8%.
What correlates most strongly with skilled nursing occupancy?
Of the variables available in the CMS files, nursing staff turnover showed the strongest relationship at r = −0.188, nearly double the star rating relationship. Facilities under 30% annual nursing turnover average 83.3% occupancy, against 75.6% for facilities above 60%.
Can a five-star nursing home have low occupancy?
Yes, and it is common. The June 2026 CMS data shows 762 US facilities holding the highest possible overall star rating while operating below 75% occupancy.
How is nursing home occupancy calculated from CMS data?
CMS does not publish occupancy directly. It is derived by dividing the average number of residents per day by the number of certified beds, both of which appear in the Nursing Home Provider Information file in the CMS Provider Data Catalog.
Does this mean quality does not matter in skilled nursing?
No. It means the published rating is a weak predictor of census specifically. Quality of care matters for outcomes, for survey results, for reimbursement under value-based purchasing, and for staff retention, which this analysis found tracks with occupancy more strongly than the rating does.
Where does the data in this study come from?
The CMS Provider Data Catalog, specifically the Nursing Home Provider Information file and the payroll-based journal staffing file from the June 2026 release. Both are public and free to download.
Methodology
Source
CMS Provider Data Catalog, Nursing Home Provider Information file, June 2026 release, merged with the payroll-based journal staffing file from the same release.
Population
All 14,695 Medicare and Medicaid certified nursing facilities in the file. Analyses involving star rating use the 14,396 facilities carrying an overall star rating and a usable derived occupancy figure. Analyses involving turnover use the 13,249 facilities that additionally report nursing staff turnover.
Occupancy
CMS does not publish an occupancy figure directly. We derived it as average number of residents per day divided by number of certified beds. Facilities missing either field, or with a derived occupancy above 100%, were excluded.
Statistics
Pearson correlation coefficients throughout, with Spearman run as a check against rank effects. The within-state analysis was limited to states with more than thirty rated facilities.
Limitations
This is observational data and none of these relationships establish causation. Certified bed counts do not always reflect beds actually in service, which will overstate vacancy at some facilities. Occupancy and turnover are reported on different cadences. The analysis covers only variables present in the CMS files, which exclude payer mix, local bed supply, referral volume and every other market condition that plausibly matters a great deal.
Reproducing this
Every figure here comes from public files anyone can download from the CMS Provider Data Catalog. If you want to check the work, or want the numbers for your own state, get in touch and we will send them over.
How to cite this study
Tanner, Robert. “Do CMS Star Ratings Affect Nursing Home Occupancy? A Study of 14,695 Facilities.” BedLaunch, August 1, 2026. https://www.bedlaunch.com/do-cms-star-ratings-affect-nursing-home-occupancy/

Robert Tanner
Robert Tanner is the founder of BedLaunch, a census growth consultancy for skilled nursing operators. He spent ten years as the corporate marketing resource inside a skilled nursing operating company that grew from four facilities to more than forty, most recently as Vice President of Brand and Culture, supporting facility marketing directors on referral development across the portfolio.
See what your referral sources see.
See what patients and families are seeing and thinking before they set food in your building